Alphabet Inc. is a titan in the technology industry, with its primary business being Google and its diverse subsidiaries. The company started as a search engine in 1998 and now operates in various sectors, including digital advertising, cloud computing, hardware, and software development.
Google provides a wide range of technology products and services, including internet search, online advertising, software, and hardware, with a mission to organize the world’s information and make it accessible to the general public. Other major products include YouTube, Gmail, Google Drive, Google Maps, Google Cloud, and Android.
Furthermore, Alphabet’s business extends beyond Google, owning numerous subsidiaries that research and develop cutting-edge technologies such as life sciences, investment, data analysis, artificial intelligence, and autonomous vehicles. Among these, Waymo, which develops autonomous vehicles, and DeepMind, which conducts artificial intelligence research, are particularly noteworthy.
Alphabet, with its numerous innovative projects and broad business portfolio, has become a major player in the technology industry. Therefore, its performance and stock price forecasts are topics of high interest to investors, analysts, and industry observers. The future movements of Alphabet will be a crucial indicator of the overall direction of the technology market.
Revenue per Share, EBITDA, and Diluted Net Income per Share of Alphabet Inc.
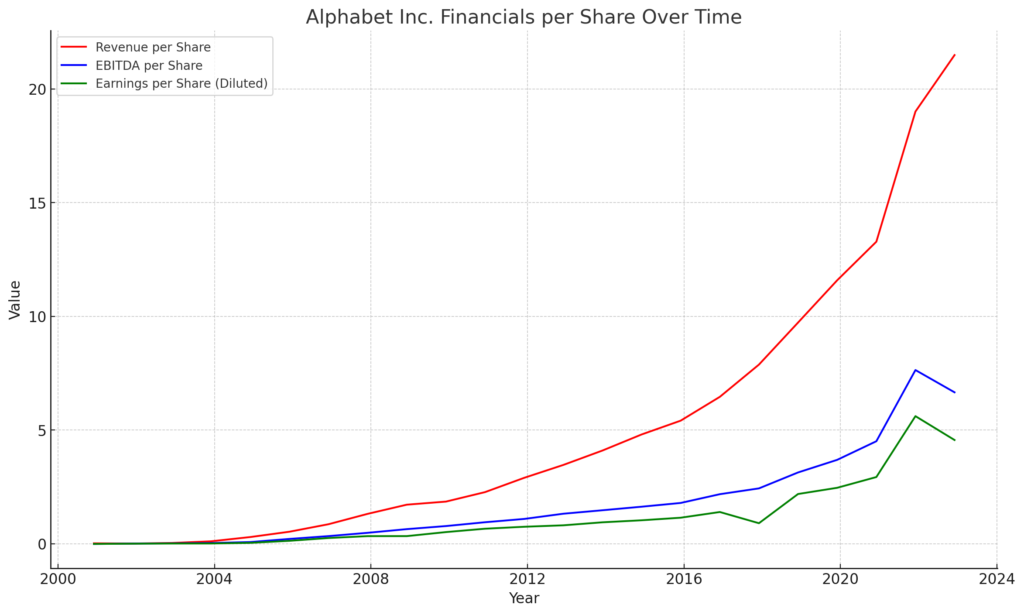
This graph shows how the revenue per share (red), EBITDA (blue), and diluted net income (green) of Alphabet Inc. have changed over time. These indicators are all important for assessing the health and success of Alphabet Inc.’s business.
The red line represents revenue per share, which is the total revenue of the company divided by the number of shares, generally considered an indicator of the company’s size and growth. The increasing trend in Alphabet’s revenue indicates that the company’s business is expanding and that its operations, such as Google’s search engine, advertising, and cloud services, are performing well.
The blue line represents EBITDA per share. EBITDA is an indicator used to evaluate a company’s profitability and cash flow, showing profits excluding taxes, interest, depreciation, and amortization. The increasing trend in Alphabet’s EBITDA indicates that the company’s operational efficiency is improving, or it has strong pricing power.
The green line represents diluted net income per share, which is the profit after all expenses and taxes divided by the number of shares, indicating the bottom-line profitability of the company. The increasing trend in Alphabet’s net income indicates that the company is managing its revenue efficiently and growing while keeping expenses under control.
The overall trend that can be read from this graph is that Alphabet has been consistently growing and improving its profitability over the past few years. This indicates that Google’s main businesses, such as its search engine, advertising, and cloud services, continue to have strong competitive power and that it is developing new revenue sources through new innovations and business expansions.
Alphabet’s Cash Flow
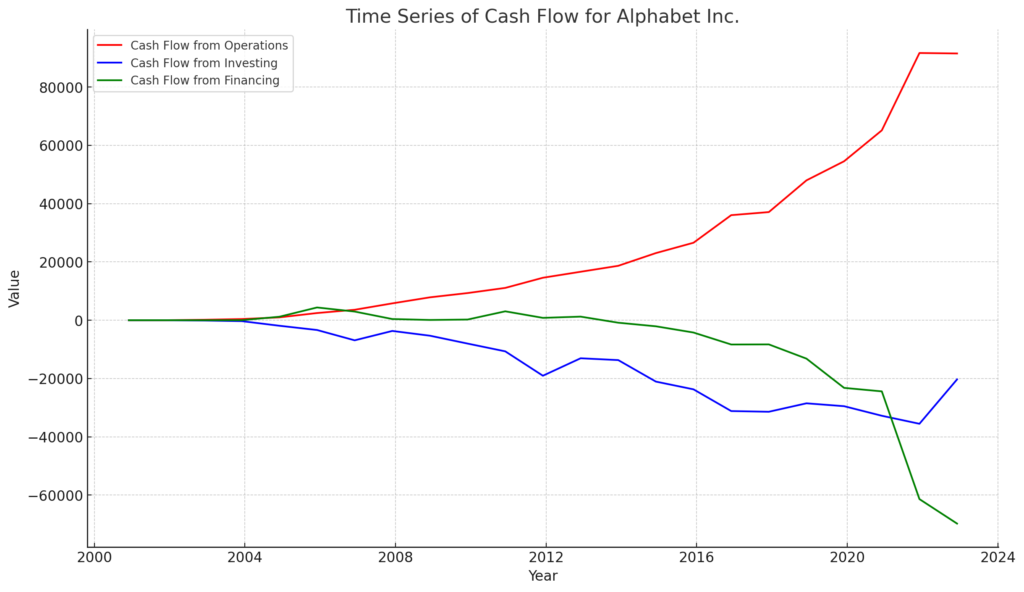
The above time-series graph provides important insights into Alphabet Inc.’s financial condition and business operations over the past several years.
Cash flow from operating activities (red line): This represents the net inflow of cash from the company’s main business operations. Alphabet, as the parent company of Google, derives most of its revenue from advertising services provided through search, YouTube, and Google Network Members’ properties. A consistently positive and growing cash flow from operating activities indicates a solid business model and effective monetization of services, which is a strong indicator of future profitability.
Cash flow from investing activities (blue line): This represents the net amount of cash obtained or used from investing activities, such as the purchase or sale of assets. For technology companies like Alphabet, a negative cash flow from investing activities is not necessarily a bad sign. It often indicates that the company is making large investments focusing on future growth, such as asset acquisition, investment in infrastructure, and funding for research and development. This aligns with Alphabet’s strategy of prioritizing technological innovation and growth, as seen in its numerous investments in areas such as cloud computing, artificial intelligence, and autonomous driving technology.
Cash flow from financing activities (green line): This represents the net amount of cash generated or used from financial activities, such as issuing or repurchasing shares, paying dividends, etc. Alphabet has historically avoided debt financing and has funded its operations through its shares and its large operating cash flow. Also, the company has chosen to reinvest its profits in the business rather than paying dividends. This approach allows Alphabet to maintain a strong balance sheet and significant financial flexibility, securing a good position for future growth opportunities.
The fact that the “cash flow from operating activities” is positive indicates that Alphabet’s main business activities (mainly Google’s advertising business) are consistently generating profits, resulting in an increase in cash. This is a strong indicator that Alphabet has a robust business model and is effectively monetizing its services.
On the other hand, the fact that the “cash flow from investing activities” is negative indicates that Alphabet is spending money on investment activities aimed at acquiring assets and expanding its business. This indicates that Alphabet is actively investing in the development of new businesses, expansion of existing businesses, and technological innovation to support its continued growth.
The reason these two cash flows are spreading like a “crocodile’s mouth” over time is that Alphabet continues to expand its business and generate more cash, while using the generated cash for investments in growth opportunities such as new businesses and technological innovations. This trend indicates that Alphabet is focusing on sustained growth and innovation.
Also, the fact that the “cash flow from financing activities” is negative indicates that the company is repurchasing shares or repaying debts.
Alphabet has been executing a large-scale share repurchase program over the past several years, which is the main cause of the negative financial cash flow. Share repurchases are actions by a company to buy back its own shares from the market, reducing the number of shares and effectively increasing the value of the remaining shares. This is done when a company believes its shares are trading below fair value or as a strategy to enhance shareholder value using surplus funds.
Also, Alphabet has very little long-term debt, so it is unlikely that there is much outflow of financial cash flow due to debt repayment.
Therefore, the fact that Alphabet’s cash flow from financing activities is consistently negative indicates that the company is actively repurchasing shares and pursuing a strategy to enhance the value of its own shares.
In summary, Alphabet’s strong cash flow from operating activities, strategic investments for future growth, and cautious financing strategy all indicate a strong financial position. These elements, combined with the company’s dominant market position and continued investment in high-growth areas, indicate a positive outlook for the company’s future performance.
Alphabet’s Balance Sheet Trends
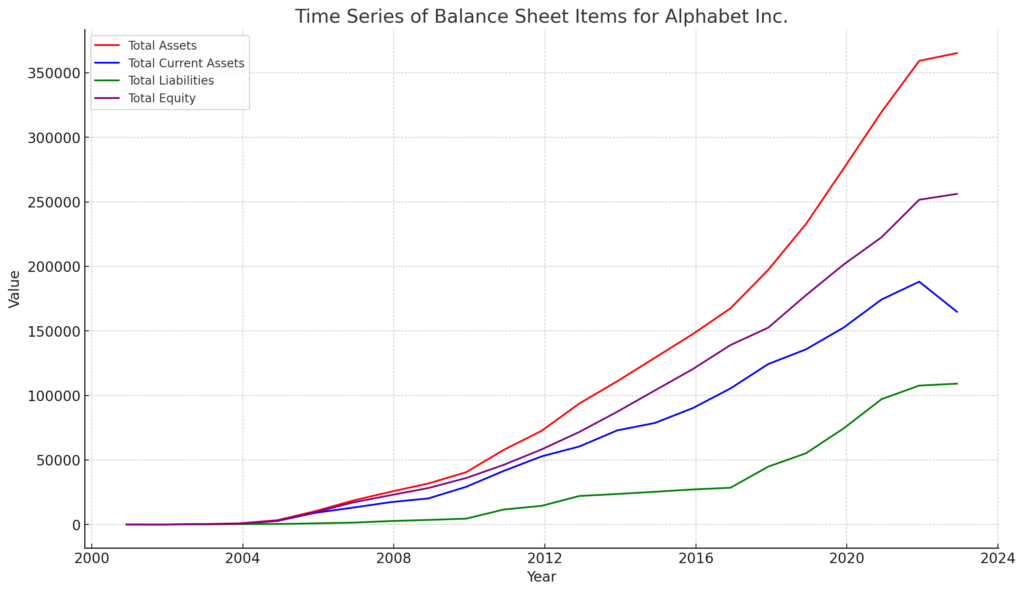
This graph shows the time series of Alphabet Inc.’s key balance sheet financial indicators, providing important insights into the company’s financial health and stability, as well as predicting future performance.
Total Assets (Red): Total assets represent all the value a company owns. The fact that Alphabet’s total assets are increasing year by year indicates that the company continues to increase its assets (cash, investments, real estate, intangible assets, etc.). This is a strong indicator that the company’s business model is successful and as a result, assets are increasing. Current Assets (Blue): Current assets represent assets that can be converted to cash within a short period (within one year). The fact that Alphabet’s current assets are increasing indicates that the company has sufficient resources to meet short-term financial needs. Total Liabilities (Green): Total liabilities represent all the debts a company owes. The fact that Alphabet’s total liabilities are relatively stable while total assets are increasing indicates that the company is managing its debts and continues to increase its own resources. Total Equity (Purple): Total equity, or shareholders’ equity, represents the amount that would be returned to shareholders if all assets were liquidated and all debts repaid. The fact that Alphabet’s total equity is increasing indicates that the company continues to reinvest its profits for growth and is increasing shareholder value. These trends indicate that Alphabet is financially sound and that its business model is sustainable. Furthermore, these indicators play an important role in Alphabet’s earnings forecasts. The increase in total assets, current assets, total liabilities, and total equity indicates that the company continues to grow and is likely to continue to generate profits in the future.
Alphabet’s Segment Performance Trends
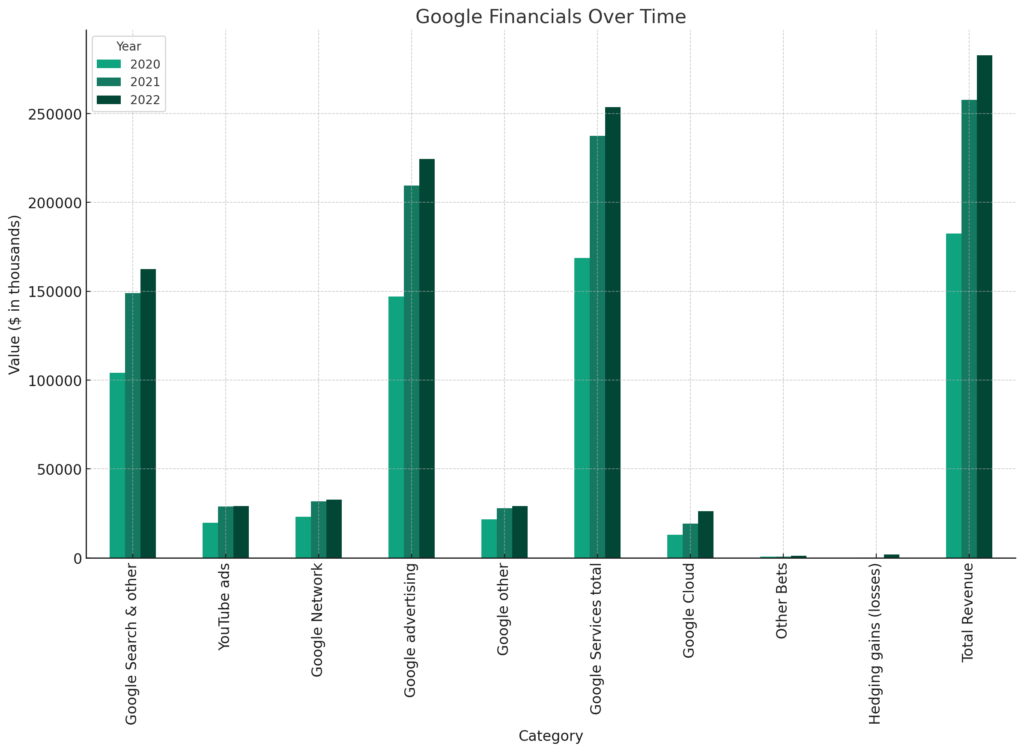
The table shows the revenues of each department in each fiscal year of 2020, 2021, and 2022: Google Search & other, YouTube ads, Google Network, Google advertising, Google other, Google Services total, Google Cloud, Other Bets, Hedging gains (losses), and total revenue.
Google Search & other: The revenue from search advertising, Google’s core business, is steadily growing. This indicates that Google’s main business is strong, which is a positive sign for future performance. However, if the growth rate is slowing, it may be a concern. YouTube ads: YouTube advertising revenue is also steadily increasing. This indicates that Google’s investment in video content and advertising is bearing fruit. Google Network: Revenue from Google’s network of third-party websites and apps is also steadily increasing. This indicates that Google’s network ecosystem is strong and growing. Google advertising: Google advertising revenue is also growing steadily, indicating that Google’s advertising business is strong. This is a favorable sign for Google’s future performance. Google other: This category may include various businesses such as hardware and the Google Play Store. The steady growth of revenue in this category indicates that Google’s other businesses are also contributing to growth. Google Services total: This is the total revenue of the above categories, showing a consistent increase. This means overall business growth. Google Cloud: The growth of Google Cloud revenue suggests that Google’s investment in cloud services is beginning to bear fruit. The cloud industry is expected to grow in the future, which is a positive sign for Google’s performance. Other Bets: This category includes Google’s long-term risky projects. Revenues are relatively low, but an increase in revenue suggests that some projects are starting to generate revenue. Hedging gains (losses): This is related to Google’s financial risk management. A positive number indicates profits from hedging transactions. Total Revenue: This is Google’s total revenue. A consistent increase in total revenue is a positive sign for Google’s future performance and stock price. These trends suggest that Google’s business is consistently growing.
Alphabet’s Regional Performance
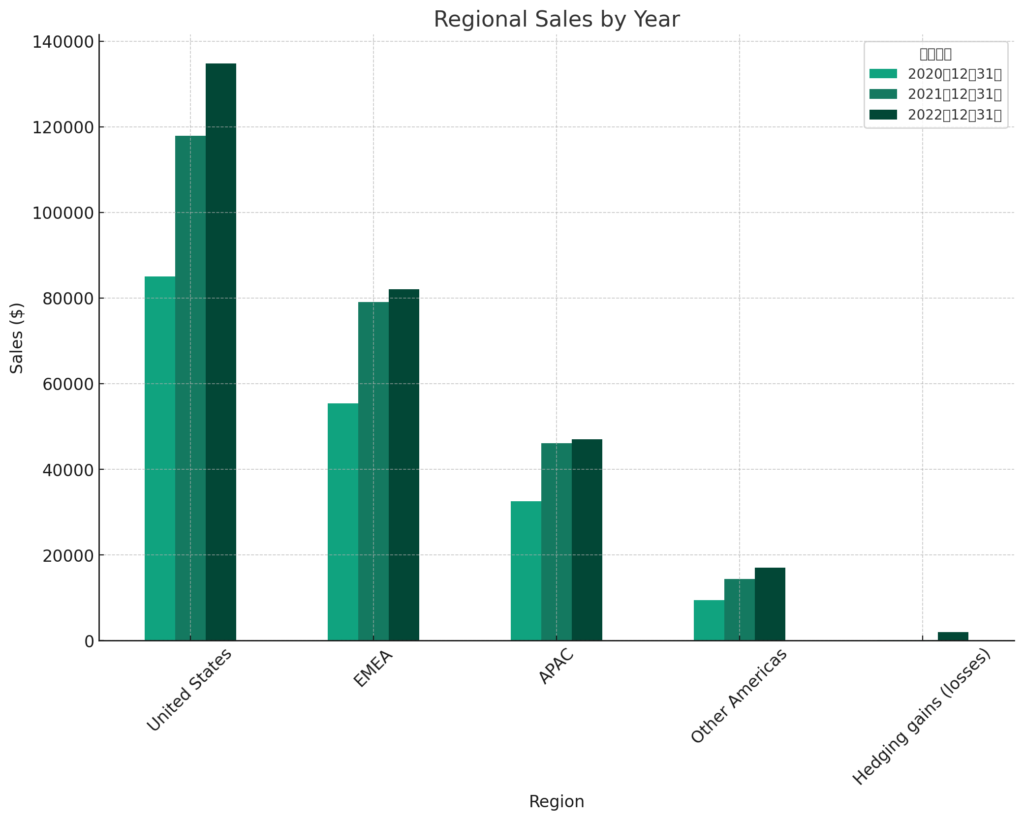
This bar chart shows the sales in each region (United States, EMEA, APAC, Other Americas) and Hedging gains (losses) for each fiscal year of 2020, 2021, and 2022. Sales are shown in U.S. dollars.
United States: Sales in this region are the highest and increasing during the observation period. The increase from 2020 to 2022 is particularly noticeable, with sales increasing by about $50,000. EMEA (Europe, Middle East, Africa): Sales in this region increased from 2020 to 2021, but decreased slightly in 2022. APAC (Asia Pacific): Sales in this region are consistently increasing from 2020 to 2022. Other Americas: Sales in this region are also consistently increasing, with a particularly noticeable increase from 2021 to 2022. Hedging gains (losses): This category has very low sales compared to other regions. However, there is a slight increase in 2022. Overall, sales in all regions are increasing during the observation period. The highest sales are in the United States, followed by EMEA, APAC, and Other Americas. These trends are likely due to various factors such as market trends in each region, economic conditions, and company strategies.
Sales in the United States and EMEA (Europe, Middle East, Africa) regions are relatively high compared to Asia. The low proportion of sales in Asia is mainly due to the fact that Google is not available in China, which has a large population of 1.4 billion. The Chinese government has adopted a closed policy on IT, and Google is excluded from the Chinese market. In China, Baidu, a domestic company’s search engine, is commonly used. Therefore, it will be difficult for Google to significantly increase its sales in Asia in the future.
Alphabet’s Stock Price and Theoretical Stock Price
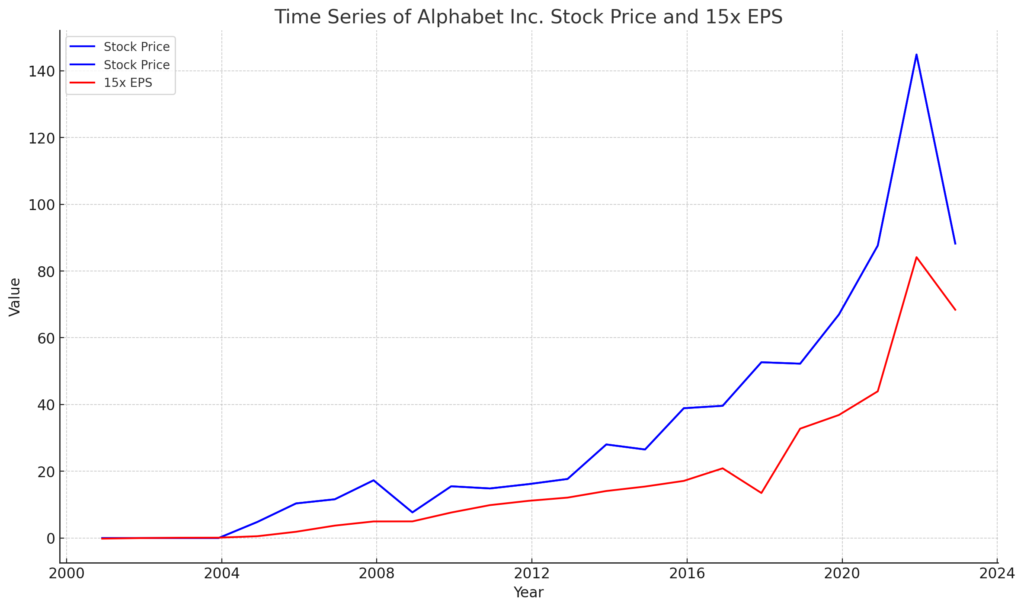
This graph shows Alphabet Inc.’s stock price (blue line) and 15 times earnings per share (EPS) (red line). 15 times EPS is a common stock price evaluation indicator, which can be considered as a theoretical stock price. The theoretical stock price is an indicator that shows the appropriate stock price of a company, and it can be used to evaluate whether the current stock price is undervalued or overvalued.
From this graph, it can be seen that Alphabet’s stock price is generally on the line of 15 times EPS. This means that when the stock price exceeds the line of 15 times EPS (i.e., when the blue line is above the red line), the stock price can be interpreted as being overvalued. Conversely, when the stock price is below the line of 15 times EPS (i.e., when the blue line is below the red line), the stock price can be interpreted as being undervalued.
Since the blue line (stock price) is above the red line (15 times EPS), it can be interpreted that the current stock price of Alphabet is at a higher level than the valuation based on EPS.
In this case, investors may think that Alphabet’s stock price may be exceeding its fair value. However, the premise that 15 times EPS is a fair valuation may fluctuate depending on specific market conditions, industry, company growth prospects, etc. Furthermore, a high stock price may reflect expectations for the company’s future growth.
Based on the latest data, Alphabet’s stock price is about $124.65, while the theoretical stock price based on 15 times EPS is about $67.35. This indicates that the stock price exceeds the theoretical stock price by about $57.30, or about 85.08%.
This can be interpreted as the current stock price of Alphabet being at a higher level than the valuation based on EPS. In other words, Alphabet’s stock price is currently overvalued when viewed from the general stock price evaluation indicator of 15 times EPS.
