This article will examine Amazon’s past performance and stock price movements, as well as future predictions. Amazon, widely known for its e-commerce business, has also seen rapid growth in its cloud business, resulting in soaring stock prices. The main points of this article are as follows:
- Amazon is making significant profits, but it is actively reinvesting them in new investments, resulting in rapid company growth.
- While Amazon is recognized as an e-commerce company, its corporate cloud service, AWS, is generating more significant profits.
- The current stock price is very high, and it is believed that growth up to about 1.7 times the current sales scale is already factored in.
Amazon.com, Inc. is the world’s largest online retailer, and its influence extends not only to the retail industry but also to many sectors such as cloud computing, digital advertising, and streaming entertainment. Amazon’s main business segments include online stores, third-party seller services, Amazon Prime, Amazon Web Services (AWS), physical retail stores, and digital advertising.
Its core business, the online store, has consistently shown solid growth through the sale of a wide range of products. Also, third-party seller services that sell products using Amazon’s platform continue to increase. Furthermore, Amazon Prime, a flat-rate membership service, offers benefits such as free shipping and streaming entertainment, securing customer loyalty.
On the other hand, the fastest-growing segment is AWS. This cloud service is an essential tool for companies to solve problems such as data management, analysis, and security, achieving high profit margins. Through physical retail stores, particularly Whole Foods Market, Amazon has also entered the food retail industry.
All these elements come together, and Amazon has the ability to compete in various markets, which has a significant impact on its performance and stock price. Amazon’s future performance will be shaped by the growth and evolution of these segments and how they interact.
Amazon’s Sales, EBITDA, and Net Profit

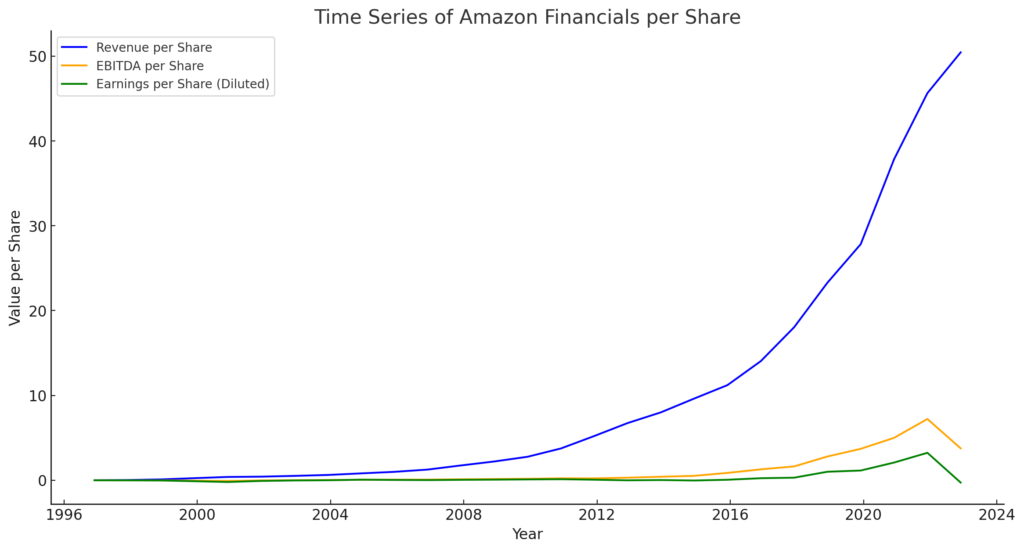
The graph above shows how Amazon’s financial indicators per share have changed over time. Specifically, it plots the following three indicators:
Revenue per Share: Blue Line EBITDA per Share: Orange Line Earnings per Share (Diluted): Green Line These indicators are important for comparing Amazon’s financial situation over time. For example, Revenue per Share is seen to increase over time, indicating that Amazon is consistently growing.
Amazon’s sales have been expanding rapidly for over a decade, and this momentum is expected to continue. However, its profit growth is not as strong as its sales, and it appears to be on a relatively gentle upward trend. Also, Amazon does not pay dividends to shareholders.
There are mainly two interpretations for this phenomenon.
Amazon may be lowering product prices through sales and campaigns. As a result, the company may be temporarily sacrificing profits to expand sales. Another perspective is that Amazon may be making sufficient gross profits but reinvesting a large amount of profit in new investments. If this is true, it may appear that profits are low on the surface. Considering these possibilities, which scenario applies to Amazon?
The conclusion is (2). To understand why, you need to look at the trend in cash flow.
Amazon’s Cash Flow

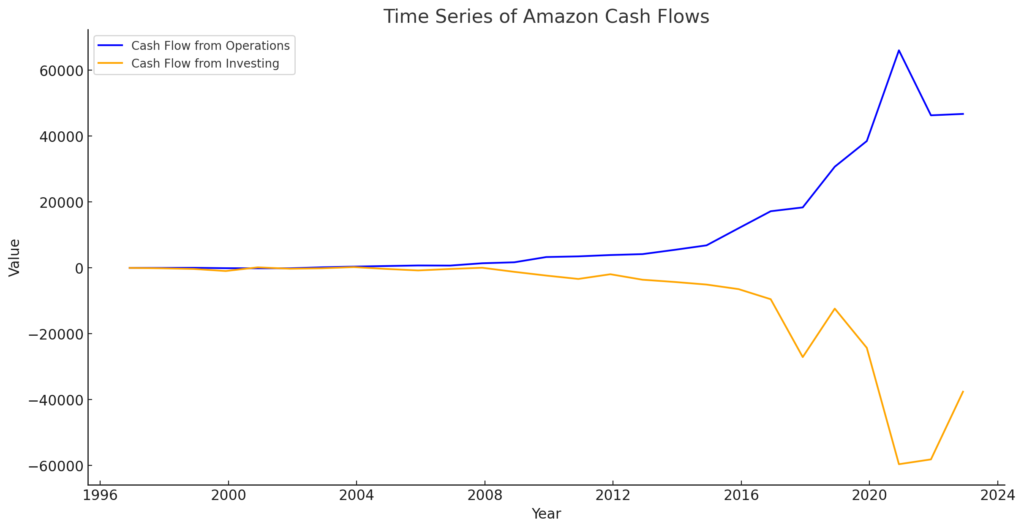
The graph above shows the time series data of “Cash Flow from Operations” (blue line) and “Cash Flow from Investing” (orange line). These indicators show how Amazon’s cash flow has changed over time.
“Cash Flow from Operations” represents the cash flow generated from a company’s regular business activities and is generally considered a good indicator of a company’s health. On the other hand, “Cash Flow from Investing” represents the cash flow obtained from investment activities, such as the purchase of new equipment or the sale of existing assets.
Observing the graphs of “Cash Flow from Operations” (blue line) and “Cash Flow from Investing” (orange line) provides interesting insights into Amazon’s business strategy.
First, Amazon’s “Cash Flow from Operations” (blue line) can visually be seen to be rising. This indicates that Amazon’s main business is generating profits and, as a result, generating significant operating cash flow.
On the other hand, “Cash Flow from Investing” (orange line) is decreasing in the negative direction. This indicates that Amazon is actively reinvesting its earnings in new investments. This represents cash outflows for investment activities necessary for the growth and expansion of the company, such as new businesses and equipment investments.
These movements draw a shape like a crocodile’s mouth. This “crocodile’s mouth” symbolizes Amazon’s powerful growth engine. It’s a cycle where the company makes solid profits (operating cash flow) and reinvests those profits in new investments (investment cash flow). This cycle supports Amazon’s rapid growth and expansion.
Amazon’s Segment Performance

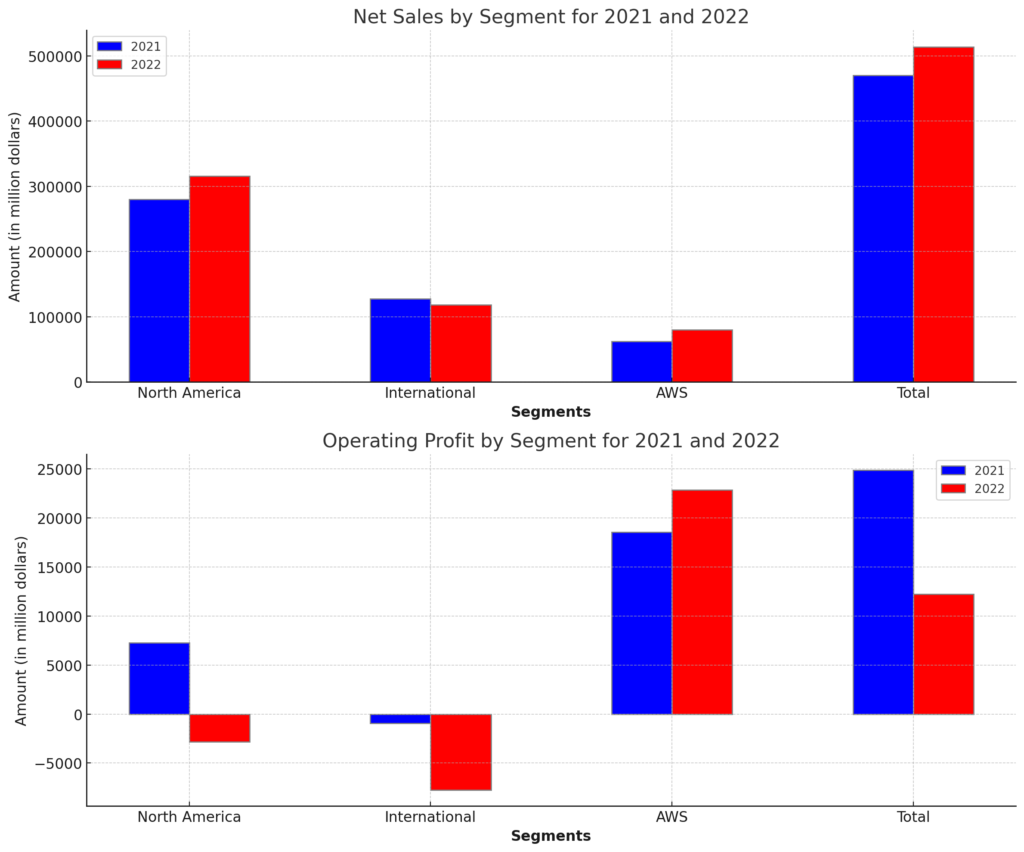
Here are graphs showing net sales and operating profit by segment for 2021 and 2022.
The upper graph shows net sales, and the lower graph shows operating profit. The blue bars represent 2021, and the red bars represent 2022. This allows you to visually understand the changes in the performance of each segment over two years.
North America Segment: This represents Amazon’s e-commerce (EC) business in North America (mainly the United States and Canada). From 2021 to 2022, net sales increased from $279.833 billion to $315.880 billion. However, operating profit decreased from $7.271 billion to -$2.847 billion. This could be due to increased operating costs or changes in market conditions. International Segment: The international segment represents Amazon’s EC business in regions outside North America. This includes Amazon shopping in Japan. From 2021 to 2022, net sales decreased from $127.787 billion to $118.007 billion. Also, operating profit decreased from -$924 million to -$7.746 billion. This could be due to increased competition in international markets or region-specific challenges. AWS Segment: AWS (Amazon Web Services) is Amazon’s business division that provides cloud computing services. AWS provides IT resources such as servers and storage on demand, helping companies efficiently operate their IT infrastructure. A key feature of AWS is its flexibility to easily scale resources up or down as needed. This is a major attraction for companies that need large-scale data processing. From 2021 to 2022, net sales increased from $62.202 billion to $80.096 billion, and operating profit increased from $18.532 billion to $22.841 billion. This reflects the rapid growth of the cloud computing market and AWS’s strong position in it. Overall, Amazon’s net sales in 2022 were $513.983 billion, up from $469.822 billion the previous year. However, operating profit decreased from $24.879 billion to $12.248 billion. These results are due to differences in the performance of each segment and changes in market conditions and economic conditions.
These figures are important indicators for understanding the trends in Amazon’s business. In particular, the strong performance of AWS suggests that cloud computing could be a major growth engine for the IT industry in the future.
The AWS segment is generating more profit than Amazon’s e-commerce (EC) business and is expected to be a very promising segment in the future. To reiterate, from 2021 to 2022, AWS’s net sales increased from $62.202 billion to $80.096 billion, and operating profit increased from $18.532 billion to $22.841 billion. This shows the phenomenal growth of the cloud market and that AWS is achieving high profit margins
in this market. From these results, it can be confirmed that AWS is becoming a major growth engine for Amazon.
So far, Amazon has shown strong resilience to economic fluctuations. For example, during the Lehman shock in 2008, Amazon’s performance was not significantly affected. This may be because Amazon was still in the growth phase at the time and was less affected by the overall economy.
However, as the e-commerce market matures, Amazon’s EC business may be affected by certain economic cycles. In particular, in the North American and International segments, operating profits have decreased from 2021 to 2022. This could be due to market saturation, increased competition, or other region-specific challenges.
On the other hand, AWS’s cloud business is expected to continue to be a defensive business that is less affected by the economy. This is because companies that have adopted AWS find it difficult to stop their already built and operating IT systems, even if the economic situation becomes severe. This is the same reason why the mobile phone industry is a defensive business that is strong against the economy. Therefore, AWS will continue to be an important stable source of growth for Amazon’s business portfolio.
By understanding the characteristics and growth opportunities of these segments and continuing an adaptive strategy, Amazon is expected to continue its high growth in the future.
Amazon’s Theoretical Stock Price and Stock Price

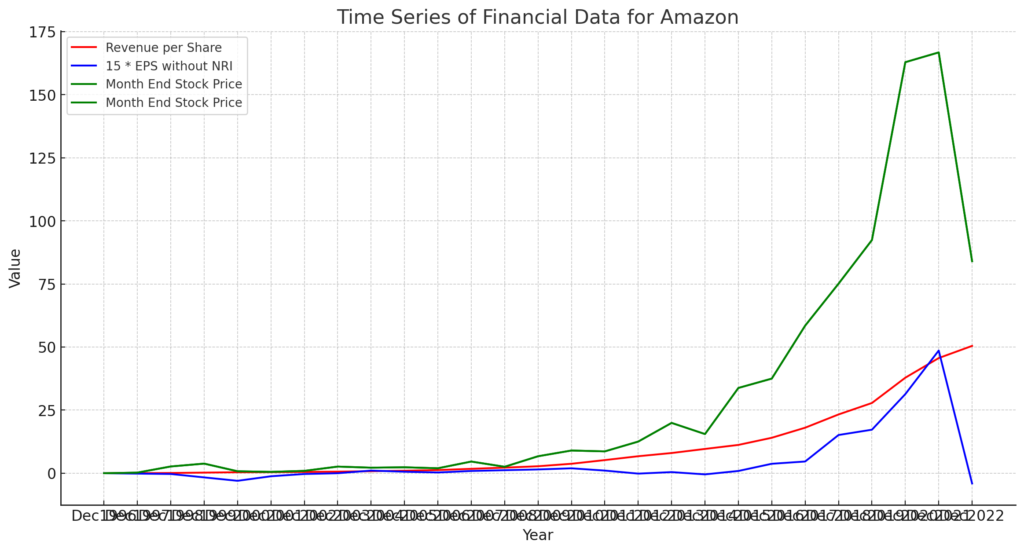
Revenue per share is shown in red, 15 times the theoretical stock price (EPS (Earnings per Share)) is shown in blue, and the end-of-month stock price is shown in green.
The current (end of 2022) Amazon stock price is $84. On the other hand, the latest earnings per share (EPS) is -$0.27. This indicates that Amazon is currently incurring losses, and as a result, the price-earnings ratio (PER) cannot be calculated.
Since EPS cannot be used, I will introduce a way to measure the stock price level using sales. One idea is that, as a general rule, total sales, total assets, and market capitalization are roughly the same order of magnitude. Applying this to Amazon, the revenue per share is $50.45. If you think this will grow to the current stock price, you can interpret that growth up to about 1.7 times the current sales is already factored into the current stock price.
The reason for measuring the degree of future growth inclusion with sales rather than profits is that Amazon is currently actively reinvesting the profits it has earned. As a result, looking at current profits alone may not accurately reflect Amazon’s true value.
In summary, Amazon continues to grow rapidly, and this growth is expected to continue in the future. However, the current stock price already includes growth up to about 1.7 times in the future. Therefore, one strategy is to consider investing when the stock price is slightly adjusted and a sense of cheapness emerges.
One risk to consider when investing is the possibility that Amazon’s future growth will be lower than expected. In the EC site, Amazon currently monopolizes the market in the world excluding China. However, in the future, Alibaba and other competitors may enter the market and hinder Amazon’s growth.
Also, competition is intensifying in the cloud business. Companies like Google and IBM are gaining strength in this market, and these competing companies may hinder Amazon’s growth. Both the EC site and the cloud business are highly competitive fields, and it is necessary to pay attention to Amazon’s future movements.
